SHIB Price Prediction: Will It Hit $1?

#SHIB
- SHIB is trading below its 20-day MA, indicating short-term bearish pressure.
- MACD shows a slight bearish crossover, but Bollinger Bands suggest potential volatility.
- A breakout above $0.00001400 resistance could shift sentiment to bullish.
SHIB Price Prediction
SHIB Technical Analysis: Key Levels to Watch
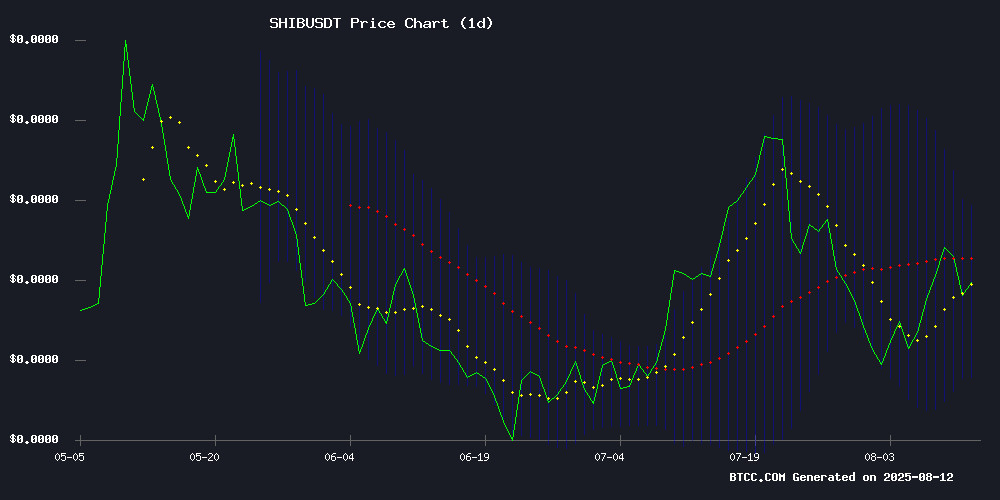
According to BTCC financial analyst James, SHIB is currently trading at 0.00001293 USDT, slightly below its 20-day moving average of 0.00001300. The MACD indicator shows a slight bearish crossover with the MACD line at 0.00000083 and the signal line at 0.00000088, indicating potential short-term weakness. Bollinger Bands suggest a range between 0.00001160 (lower band) and 0.00001439 (upper band), with the middle band at 0.00001300 acting as a pivot point. A break above the upper band could signal a bullish momentum, while a drop below the lower band may indicate further downside.
SHIB Market Sentiment: Bears in Control but Breakout Potential Looms
BTCC financial analyst James notes that SHIB is facing a critical resistance at $0.00001400, with bears currently dominating the market. However, headlines suggest a potential breakout in August, fueled by growing meme coin rivalry and bullish monthly forecasts. The technical outlook aligns with this sentiment, as SHIB's Bollinger Bands and MACD indicate a possible reversal if key resistance levels are breached.
Factors Influencing SHIB’s Price
SHIB Price Faces Critical Test at $0.00001400 Resistance as Bears Take Control
Shiba Inu's price trajectory hit a significant roadblock at the $0.00001400 resistance level, with a 4.42% decline over the past 24 hours. The SHIB/USDT pair shows weakening technical indicators as bearish sentiment dominates the market.
The August 10 rejection at $0.00001400 proved decisive—this level represents a historical supply zone where institutional sellers consistently offload positions. Earlier bullish projections of $0.000016 now appear increasingly disconnected from on-chain reality.
Momentum indicators flash warning signs despite a neutral RSI reading of 49.00. The gap between predicted targets and actual price action underscores the market's current risk-off posture toward meme coins.
Shiba Inu (SHIB) Charts Signal Potential Breakout in August
Shiba Inu faces a critical technical test as it approaches a persistent downtrend line that has thwarted three previous breakout attempts. The meme coin trades at $0.00001330, with chart analysts noting tight price compression that typically precedes significant volatility.
A confirmed breach of the 1553 trendline could propel SHIB toward $0.00003344, with $0.00004551 emerging as a secondary target. Weekly charts reveal constrained price action near $0.000001, where mixed candle wicks and clinging EMAs reflect market indecision following recent momentum.
The token must first conquer the $0.000002 resistance to establish upward traction. Bollinger Band contraction signals building pressure, though directional bias remains unresolved. Volume trends will ultimately determine whether August delivers a decisive breakout or another rejection.
Shiba Inu Price Prediction: Monthly Forecasts & Emerging Meme Coin Rivalry
Shiba Inu's price trajectory for the remainder of 2025 is gaining traction as meme coin markets show renewed vigor. Trading near $0.00001320 with a $7.67 billion market cap, SHIB's volume surge aligns with analyst optimism and retail interest reminiscent of Dogecoin's historic rallies. Projections suggest a potential 172% ROI by September, fueled by market catalysts and community momentum.
Meanwhile, Maxi Doge emerges as a high-risk alternative in the meme coin niche, capitalizing on investor appetite for speculative plays. The competitive landscape intensifies as established tokens like SHIB face pressure from new entrants vying for market share.
Will SHIB Price Hit 1?
Reaching $1 per SHIB is highly improbable given its current price of 0.00001293 USDT and its massive circulating supply. For SHIB to hit $1, its market capitalization would need to exceed that of major global assets, which is unrealistic in the foreseeable future. However, short-term price movements could see SHIB testing resistance levels around 0.00001400 USDT, with potential for a breakout if bullish momentum builds.
| Key Metric | Value |
|---|---|
| Current Price | 0.00001293 USDT |
| 20-Day MA | 0.00001300 USDT |
| Bollinger Bands | 0.00001160 - 0.00001439 USDT |
